

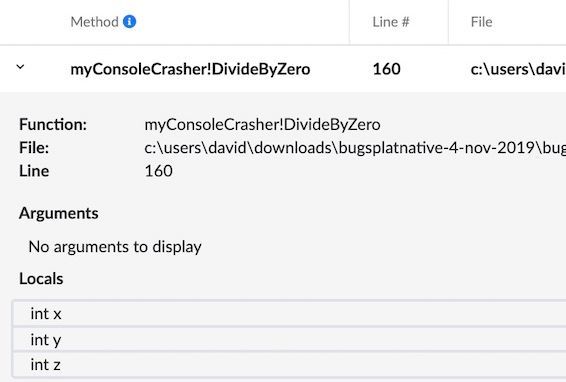
When a native C++ application crashes, a stack trace tells you where it died: the function, the file, the line. What it usually doesn't tell you is why. For that, you've traditionally had to pull the crash onto your own machine, fire up a debugger, and reconstruct the state the program was in when it went down.
BugSplat skips that step. For Windows native crashes, the crash report includes the local variables and function arguments at each level of the call stack, so you can see the actual values your code was working with at the moment it failed, right there in the report.
Why the values matter
The whole point of crash reporting is to collapse the traditional debugging process. Instead of waiting for a user to describe a problem, then trying to reproduce it, you get told when, where, and how often your code is crashing, automatically.
Local variables and function arguments take that one step further. A stack trace points you to the failing line. The variable values tell you what was true when that line ran. Together, they often hand you the root cause directly, no local debugging session required. That's the difference between knowing a function crashed and knowing it crashed because a value you assumed was non-zero wasn't.
A concrete example
The fastest way to see why this is useful is a simple one. Here's a divide-by-zero crash from our sample myConsoleCrasher application.
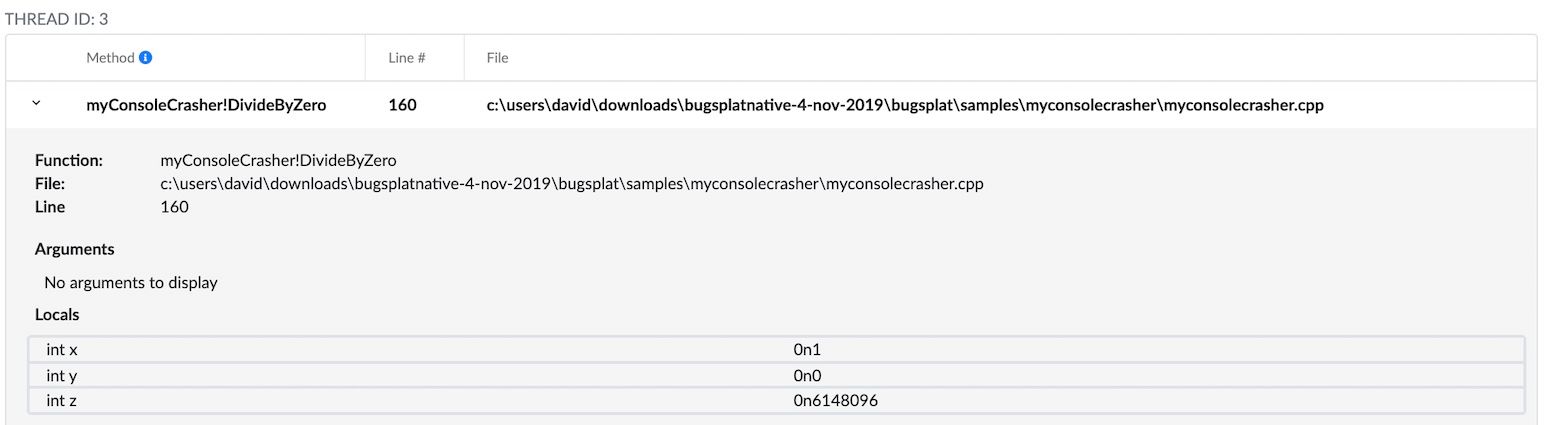
The stack trace tells you a division operation failed. On its own, that's a starting point, not an answer. But look at the local variables: the only one with a value of zero is y. There's your root cause, sitting in plain sight. You didn't have to reproduce anything, attach a debugger, or guess which of several variables was the culprit. The report told you.
Most real crashes are messier than a divide-by-zero, but the principle holds. When you can see the values your code was holding at the moment of the crash, a lot of "I have no idea why this happened" turns into "oh, that's why."
See it on your own crashes
The best way to see this is on a real crash. Start a free trial, wire up one of our native integrations, and submit a test crash. Once it lands in your dashboard, open the report and you'll find the local variables and function arguments right there on the Crash page, each level of the call stack with the values your code was holding when it failed.
If you're already a BugSplat user capturing native crashes on Windows, that data is waiting in your reports right now. Go open a recent one and have a look.
Questions, or a good story about a crash this helped you crack? We'd love to hear it. Reach us at support@bugsplat.com.
Happy bug hunting.