
What Is in a Crash Report?
Discover what’s inside a crash report and how detailed crash data helps developers diagnose and fix issues quickly.

Joey P
Head of Product at BugSplat
It is, admittedly, incredibly frustrating to fall behind on bug fixes when you would rather be checking other (more important) things off your list. Unfortunately, this is too often the default state of the busy developer.
When you are behind on your to-dos, the coffee pot is empty, and it has been too long since you last stood up from your desk, the last thing you want to see is another mysterious issue submitted and assigned to you.
All you get is a vague note about what was happening and maybe a stack trace that could point to half your codebase. You end up spending hours chasing logs, trying to reproduce the issue, and wondering what piece of the puzzle you are missing.
Automated crash reporting was built to break this loop and stop the cycle of guessing, logging, and chasing ghosts. But what actually needs to be in a crash report to help you get ahead of critical defects?
A great crash report is like a detailed treasure map. It does not just mark where things went wrong. It gives you a key, a sense of scale, and even a bit of narration to lead you to the right spot. Each clue adds context until you are standing directly over the defect that caused it all.
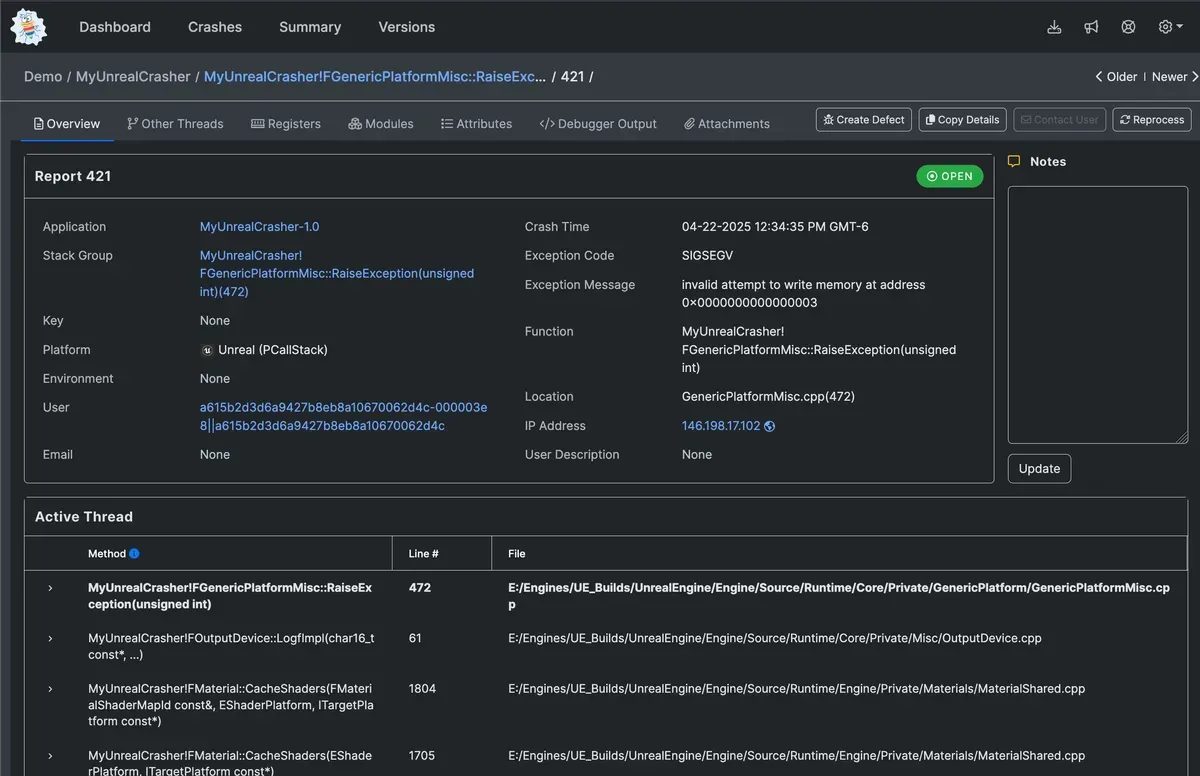
In a BugSplat crash report, each submission includes dozens of structured data points that describe what happened, where it happened, and why. Together, these create a complete picture of the crash and turn raw failure data into a clear, actionable path toward a fix.
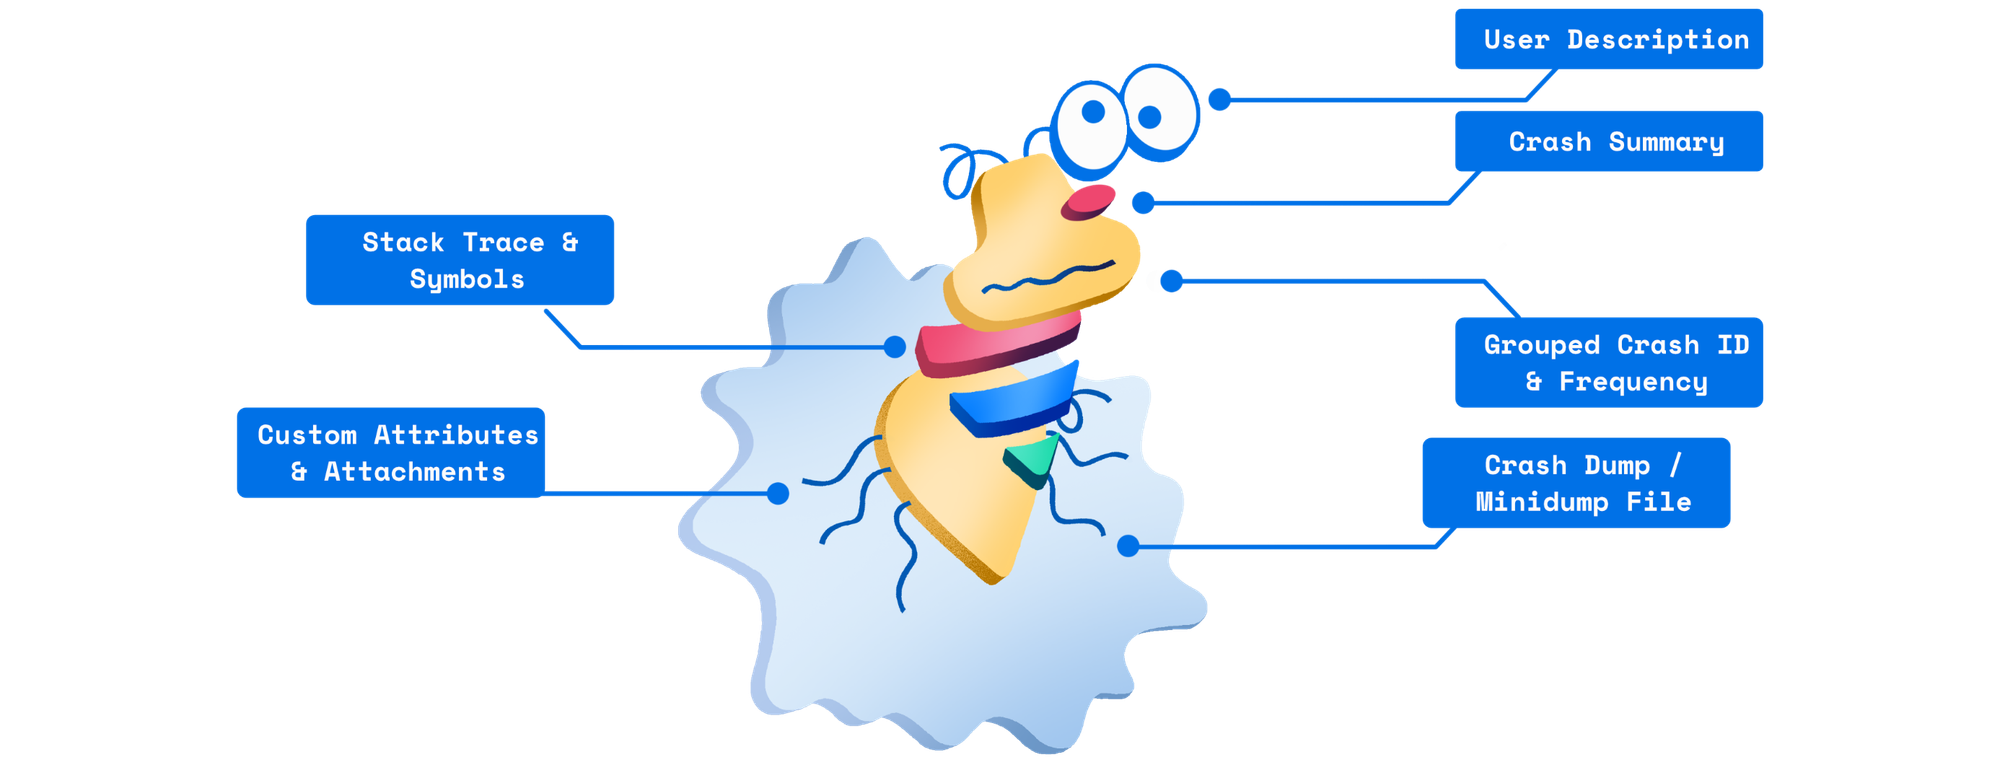
Anatomy of a Great Crash Report
Here are the six key layers every developer wants to see in a crash report.
Minidump or Memory State — The Foundation of Every Crash Report
At the heart of every crash report is the minidump, a compact snapshot of your application’s memory at the exact moment it failed. It is the raw material that every other part of the crash report is built from.
The minidump captures the state of every thread, stack, and variable when the crash occurred. BugSplat processes that data through a system similar to a debugger to reconstruct what your app was doing. From that raw information, it extracts the stack trace, loaded modules, system info, and other diagnostic details that appear throughout the crash report.
In other words, the dump is the foundation, and the rest of the report is the story built from it. Without it, you lose the deep context that helps pinpoint the real cause of a crash.
Configuring your app to send this dump data is a critical setup step. It is what allows BugSplat to turn a simple “something broke” moment into a complete, traceable map of what went wrong and where to fix it.
Stack Trace — The Trail That Leads to the Crash
Once the raw data is captured, the stack trace becomes the trail of breadcrumbs that shows exactly how you got there. It lists every function call that led to the crash, in precise order.
BugSplat parses the minidump and uses your uploaded symbol files to resolve raw memory addresses into readable function names, source files, and line numbers. What you see in the dashboard is not just raw data. It is a human-readable reconstruction of your program’s exact call path.
This is where the treasure map starts to take shape. Instead of staring at cryptic hex addresses, you are looking at clean, navigable trails that lead directly to the bug.
Attachments — The Artifacts That Tell the Rest of the Story
Some crashes cannot be solved by stack traces alone. That is why BugSplat lets you attach custom artifacts such as screenshots, log files, or repro videos directly to your crash reports.
These attachments give you real-world context: what the user was doing, what the screen looked like, and any custom logs your app generated along the way. It is the difference between knowing where the bug happened and understanding how it happened.
For QA and support teams, attachments eliminate the back-and-forth of “can you send me your logs?” Developers get a complete story in one place, no scavenger hunt required.
Custom Attributes — The Details That Matter to You
Every product is different, which means every crash tells a slightly different story. Custom attributes let you define your own data fields and include them with every crash report. These might be a player’s session length, GPU type, graphics settings, game mode, or internal feature flags.
These attributes become powerful filters for analysis. You can group crashes by game level, hardware, or release channel, instantly revealing patterns and priorities.
In BugSplat, these values appear right next to the core crash data, giving developers, QA, and producers a shared, consistent view of what is really happening in the wild.
App Version and Build Metadata — The Coordinates That Give You Context
Every map needs coordinates. Build metadata tells you where and when the crash occurred, such as which version, build number, or commit introduced it.
BugSplat automatically tags every report with version and build identifiers, commit hashes, and release information when available. This gives teams a timeline of stability across versions and makes it easy to confirm when a fix worked in production.
Crashes are rarely random. Version tagging helps you see which builds are getting cleaner and which are introducing new problems. That is how you measure real progress.
User Description — The Human Clue
Finally, there is the note from the person who experienced the crash. “Clicked Start and the game froze” might sound small, but it can turn guesswork into understanding.
These user or QA-provided descriptions bridge the gap between machine data and human behavior. They explain what the player was doing, what they expected to happen, and what went wrong.
BugSplat makes it easy to include this step in your crash dialog or QA workflow. Those short comments often close the loop, connecting what the system recorded with what the person actually experienced.
Wrapping Up
These layers are gold for helping developers find and fix crashes faster. Each one adds another piece to the map that leads you from failure to fix.
When crash reports are automatically collected, searchable, and organized with the right context, including attachments, logs, and the details developers actually need, that’s when the real magic happens. You spend less time reproducing bugs and more time fixing them, knowing exactly what needs attention in this release or the next.
At BugSplat, we go even further. Every crash can include IP address, user email, full debugger output, platform details, and a wealth of other valuable context.
The difference is how that information is presented. Instead of a firehose of raw data that buries critical issues, BugSplat organizes each report like a true treasure map that guides you straight to the fix.
We’ve spent more than a decade working with top development teams to make this data easy to collect, simple to understand, and immediately useful.
If you would like to see how it works in practice, you can start a free trial or email me directly at joey[at]bugsplat.com with any questions.

Subscribe to our newsletter
Get the latest posts and updates delivered directly to your inbox.